
1
Tell me how it plays.
Order, then describe the game, the bets, the bankroll, the win goal and the loss limit. I ask before I code.
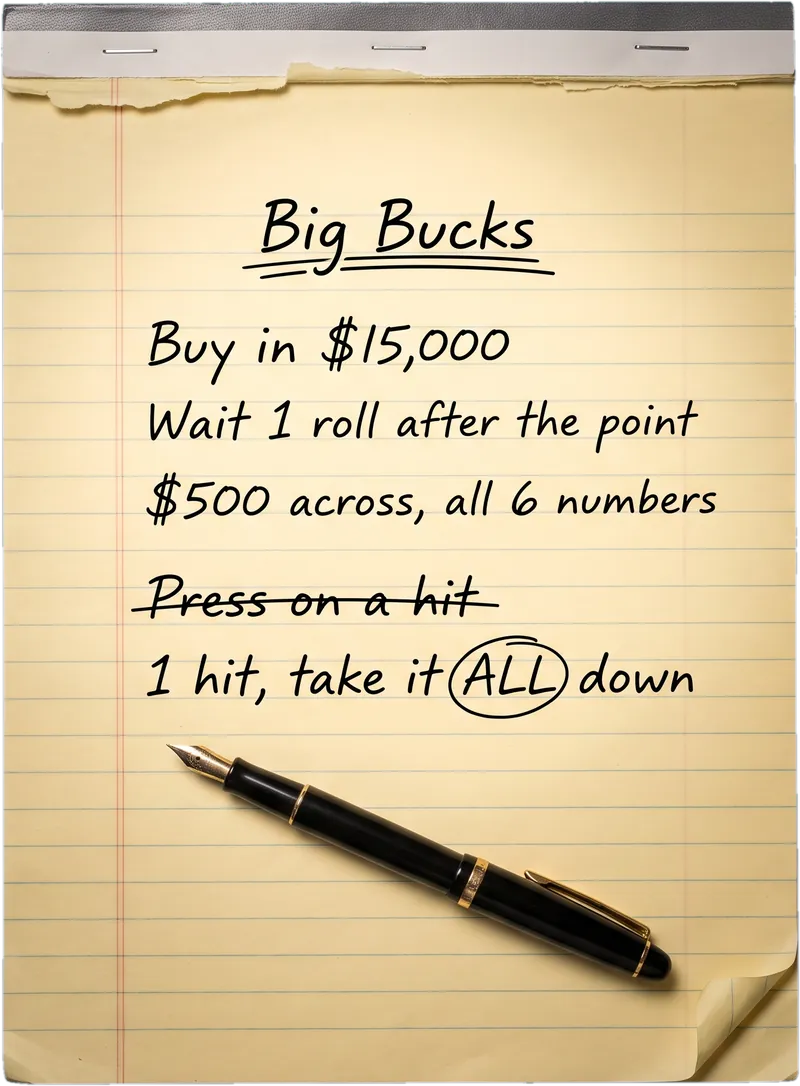
“Pass line with double odds. Press the 6 and 8 after two hits. Walk when I'm up half my buy-in.”



Craps · Crapless · Roulette · Baccarat
Describe your system and I code it in the DiceData Engine, run it through 100,000 bots, and share the results with you. I'll answer your questions along the way.
Checkout first, then a short form asks how the system plays.
“My custom scenario was well worth the investment.”
How it works
Order, then describe the game, the bets, the bankroll, the win goal and the loss limit. I ask before I code.
I build your exact logic in the DiceData Engine and test it roll by roll until it plays the way you described.
Plays as described
Ranked against every system already tested, with TrueScore, Long Term, Comps, Test Drive and Replay.
Reviews
Working with Matthew was easy.
“Working with Matthew was easy. I submitted my methodology, had a couple of back & forth e-mail exchanges to clarify, and in a short time, I received the results. I learned that my new strategy was riskier than the methodology I have used for years. My custom scenario was well worth the investment.”
Turnaround was incredibly quick.
“I commissioned Matthew to analyze a strategy I had been working on. Turnaround time was incredibly quick. Communication was easy and professional. Matthew asked insightful questions to help clarify the requirements. His analysis will definitely help me fine tune my playing style. I'm a very satisfied customer.”
This is real math.
“Wow, if you play craps, and wish to see exactly what your system will produce, this is the fellow to talk to. This is not from the table, winning or losing overtime, this is real math. Nothing replaces intuition and a little bit of luck, however, this analysis will give you the best indication of reality.”
The offer
For having me build it
+$49 for each additional system in the same run
One flat price
For work beyond a single run
Priced to the project
All simulation sales are final once the run is finalized. You can always reach me at hello@dicedata.info. Report live in 2-5 business days.
FAQ
No. All casino games have a negative expectation. The house always has an edge.
Yes. The report lives on a private page only you can open, and its Compare row is visible to you alone. It never enters the public catalog. Share links are there if you want a second opinion.
The report shows the exact win rate, the ceiling, the catch, and which dial to turn. That is the product.
Bring it. The engine plays your exact logic, roll by roll, however many moving parts it has. I read every request and email you before anything runs, so anything unclear gets settled first.
Report live in 2-5 business days.
Checkout first, then a short form asks how the system plays.
Not ready? See the plans